

Condition monitoring used to live in its own corner of a plant — a standalone laptop a vibration technician carried around once a month, disconnected from everything else running the facility. That model is disappearing. As automation architectures mature, condition monitoring is being pulled into the same data fabric as PLCs, SCADA systems, and MES platforms, and the plants getting the most value out of it are the ones treating monitoring data as another automation signal rather than a separate reporting exercise.
The shift matters because a fault detected in isolation is only half useful. A fault detected and automatically correlated with production scheduling, safety interlocks, or process control logic is what actually prevents damage and downtime. Getting there requires thinking through integration at the architecture level, not bolting a dashboard on after the fact.
Where Condition Monitoring Sits in the Automation Stack
Most industrial automation architectures follow a rough hierarchy: field devices and sensors at the bottom, PLCs and controllers coordinating machine-level logic above that, SCADA and HMI systems providing plant-wide visibility, and MES or ERP systems handling production and business logic at the top. Condition monitoring data can, and arguably should, feed into multiple layers of that stack simultaneously.
At the field level, a motor current signature analysis system or a vibration sensor produces raw signal data. That data gets processed — either at the edge or in a server — into meaningful indicators: bearing fault indices, unbalance percentages, insulation degradation trends. Those indicators are the useful payload, and the integration question is really about how far up the stack they travel and in what form.
For a maintenance technician, a browser-based dashboard showing trend lines and alarm thresholds is often sufficient. For an automation engineer trying to build interlocks that automatically derate a motor or divert production when a fault crosses a threshold, the condition monitoring platform needs to expose that data as a live tag the PLC can read — typically over OPC UA, Modbus TCP, or a similar industrial protocol.
Protocol Choices and Why They Matter
OPC UA has become close to a default choice for this kind of integration, and for good reason. It handles both real-time data exchange and historical data access, supports a security model that most IT departments will actually approve, and is vendor-neutral enough that a condition monitoring platform, a SCADA system, and an MES from three different suppliers can all speak the same protocol without custom drivers.
Modbus TCP still shows up frequently in older facilities or where a simpler point-to-point connection between a monitoring gateway and a single PLC is all that’s needed. It’s less flexible for complex data structures, but it’s simple to implement and nearly every automation platform supports it natively.
MQTT is increasingly common where condition monitoring data needs to travel to a cloud platform or a central data historian across a wide geographic footprint — multiple plants reporting into a single analytics environment, for example. Its lightweight publish-subscribe model handles that kind of fan-out more efficiently than polling-based protocols.
The practical advice here is to pick the protocol based on where the data needs to go and how quickly, rather than defaulting to whatever the monitoring vendor’s default demo uses. A platform like Artesis, built around motor current signature analysis, typically supports several of these protocols precisely because customers integrate it into such different automation environments — a food and beverage plant with a modern MES looks nothing like a decades-old rolling mill with a PLC architecture from three different eras layered on top of each other.
Building Interlocks That Actually Do Something
Data integration by itself doesn’t prevent failures — it only makes the information available. The value shows up when that data triggers action. A few integration patterns that plants use successfully:
Automatic load derating. When a monitoring system detects a developing fault — say, a rising thermal trend or an early bearing indicator — the PLC logic can automatically reduce motor load rather than waiting for a human to notice an alarm and manually intervene. This buys time, sometimes weeks, before a full repair is scheduled.
Production scheduling awareness. Feeding condition data into an MES lets planners avoid scheduling a long, uninterruptible production run on an asset showing early warning signs. This is a softer integration than a hard interlock, but it’s often where the most practical value shows up, since it lets maintenance and production coordinate instead of working from separate, disconnected pictures of asset health.
Safety system correlation. On critical rotating equipment, condition monitoring alarms can be wired into the same safety layer that already handles overcurrent and overtemperature trips, giving operators one consolidated view instead of two separate alarm philosophies to reconcile during an incident.
Common Integration Pitfalls
A few mistakes show up repeatedly in plants trying to connect condition monitoring into their automation environment:
Treating the monitoring platform as an IT project handled entirely by IT. Condition monitoring integration touches OT networks, and decisions about protocol, network segmentation, and data latency need input from automation engineers, not just IT staff following a generic integration checklist.
Over-integrating too early. Plants sometimes try to wire every fault indicator into a hard interlock on day one, before baselines have stabilized. This produces nuisance trips and erodes trust in the system fast. A more sustainable path is dashboard visibility first, soft alerts second, and hard interlocks only once the monitoring system’s alarm thresholds have proven themselves against real operating conditions for each specific asset.
Ignoring network segmentation. Condition monitoring gateways sitting on the same flat network as safety-critical control traffic is a security and reliability risk that’s avoidable with basic VLAN segmentation and firewall rules — a conversation worth having with the automation network team before, not after, installation.
Underestimating tag mapping effort. Every fault indicator needs a corresponding tag in the SCADA or PLC environment, and mapping dozens or hundreds of assets’ worth of indicators is a real engineering task, not a checkbox in a commissioning document.
The Direction This Is Heading
The plants seeing the best results from condition monitoring integration are the ones that stopped treating it as a maintenance-only tool years ago. Once fault data lives inside the same automation architecture as production and safety logic, it starts contributing to decisions beyond “when do we schedule a repair” — into how a line is scheduled, how a motor is loaded, and how quickly an operator understands what’s actually happening on the floor during an abnormal event.
Sensorless approaches to condition monitoring, of the kind Artesis specializes in for motors, generators, and pumps, tend to integrate cleanly into this picture because the underlying data — electrical signatures pulled from existing motor control infrastructure — sits naturally alongside the electrical parameters an automation system already monitors. For plants building out or modernizing their automation architecture, condition monitoring is worth designing in from the start rather than treating as an afterthought once the PLCs and SCADA layer are already locked in.
Data Modeling: Getting Tag Structures Right the First Time
One detail that gets underestimated during planning is how condition monitoring data should be structured once it reaches the automation layer. A common mistake is exposing raw indicators — a single vibration amplitude value, a single current imbalance percentage — without any context about what threshold or trend that value represents. An automation engineer building HMI screens or PLC logic needs more than a raw number; they need a structured tag set that includes the current value, the alarm and warning thresholds, a trend direction, and ideally a confidence or data quality flag, since a stale or invalid reading treated as valid can be more dangerous than no reading at all.
Building this tag structure consistently across every monitored asset, rather than ad hoc as each new machine gets added, pays off considerably once a plant scales past a handful of pilot assets. A consistent naming convention and tag structure means new HMI screens, new reports, and new automation logic can be templated rather than custom-built for every additional motor or pump added to the program.
Working With Existing SCADA and Historian Investments
Most plants beyond a certain size already have a SCADA system and a process historian in place, often representing a significant existing investment that nobody wants to duplicate or bypass. The practical goal when integrating condition monitoring is almost always to feed data into that existing infrastructure rather than standing up a separate, parallel system that operators have to check independently.
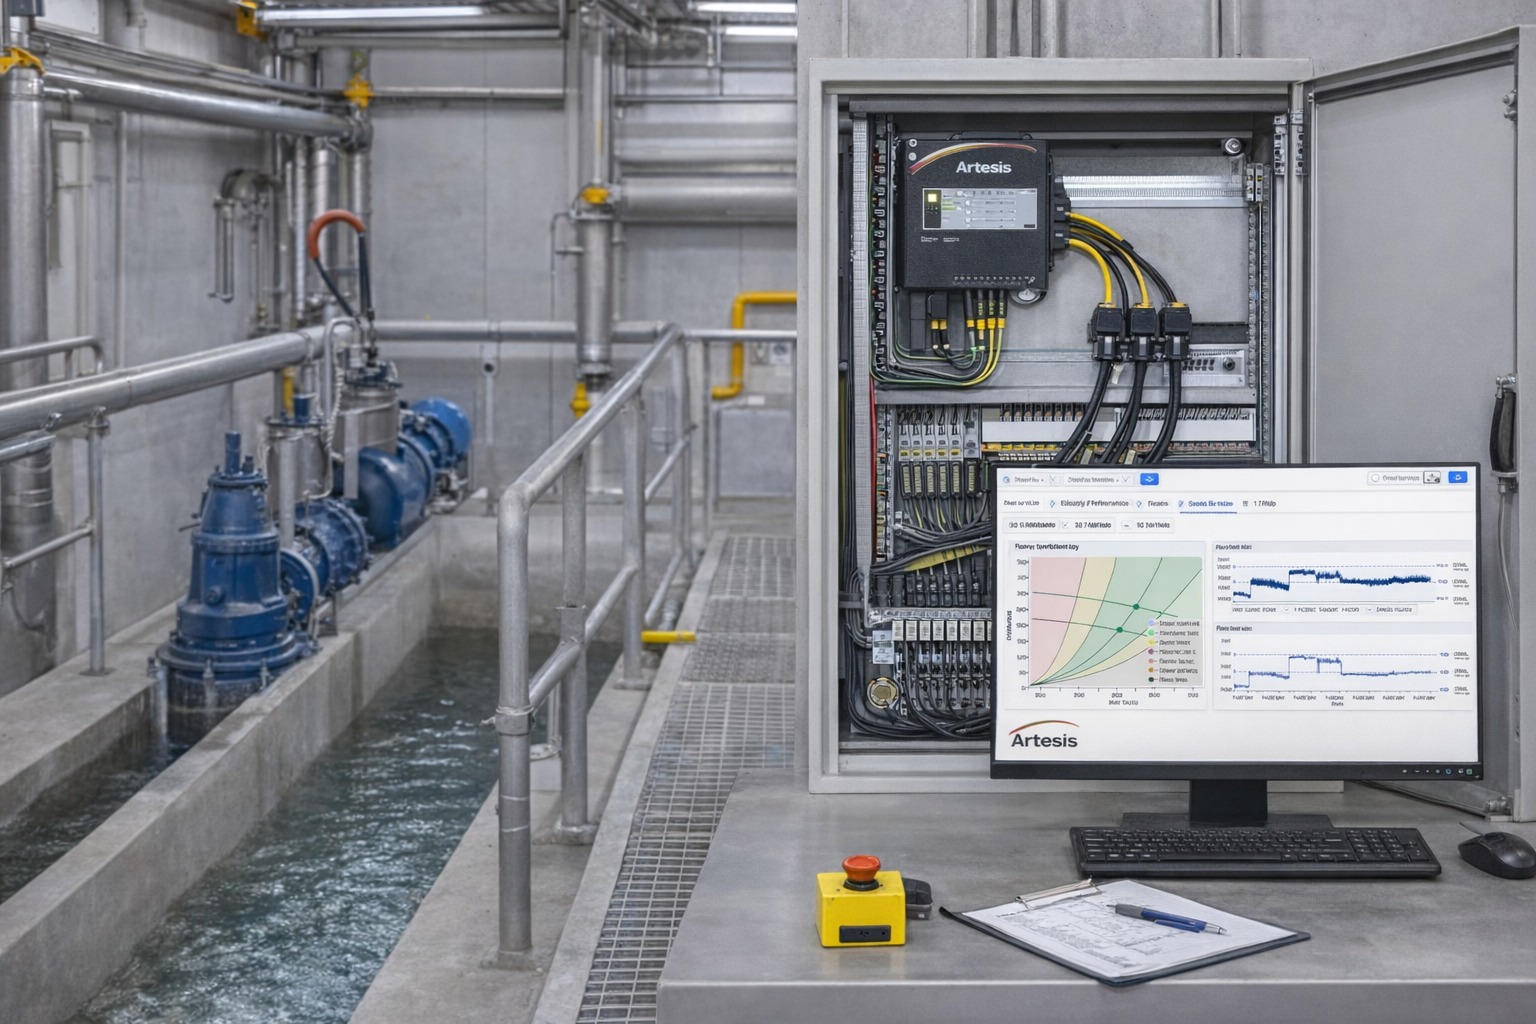
This is usually achievable without much friction as long as the condition monitoring platform supports standard historian interfaces — OPC UA and OPC HDA remain the most common — and as long as the tag naming convention discussed above is planned before rollout rather than reverse-engineered afterward. Where it gets harder is with older historian platforms that use proprietary interfaces with limited support for anything built after they were originally deployed; in those cases, a middleware layer or a periodic batch export sometimes ends up being the practical compromise, at some cost to real-time responsiveness.
A Realistic Rollout Timeline
Plants that have gone through this integration successfully tend to follow a similar sequence rather than trying to do everything simultaneously. A pilot phase, typically covering ten to twenty critical assets, focuses purely on establishing reliable dashboard visibility and validating that fault indicators correlate with real mechanical conditions the maintenance team can confirm. Only once that trust is established does integration typically extend into soft alerts feeding the MES or production scheduling system, and hard interlocks tied to safety or automatic derating logic come last, after alarm thresholds have proven stable across real seasonal and load variation for each specific asset class.
Compressing this sequence — jumping straight to hard interlocks on day one, for instance — is the single most common reason integration projects lose credibility with operations staff. A nuisance trip caused by a threshold that hadn’t been properly tuned yet can undo months of goodwill built during the pilot phase, even if the underlying fault detection technology itself is working exactly as intended.
Artesis Solutions for This Kind of Integration
Artesis e-MCM is built specifically to slot into the automation architecture described above rather than sit apart from it — it supports standard industrial protocols including OPC UA and Modbus TCP, so fault indicators, alarm thresholds, and trend data can be exposed to a PLC, SCADA system, or MES using the same integration approach an automation engineer would use for any other field device. For plants managing monitoring data across multiple production lines or multiple sites, Artesis Omnisight sits above e-MCM as a fleet-level layer, consolidating asset health, alarms, and KPIs from every monitored line into a single dashboard that maintenance, reliability, and automation teams can all reference from the same source of truth, rather than each group working from a different partial picture of the same equipment.
This combination — sensorless signature analysis at the asset level through e-MCM, and centralized visibility across the plant through Omnisight — is what lets the phased rollout approach described earlier scale cleanly from a ten-asset pilot into a plant-wide or multi-site program without needing to re-architect the integration each time coverage expands.


 White Papers
 Case Study
 Documents
 Webinars
 Events
 ROI Calculator
 FAQ
FAQ