
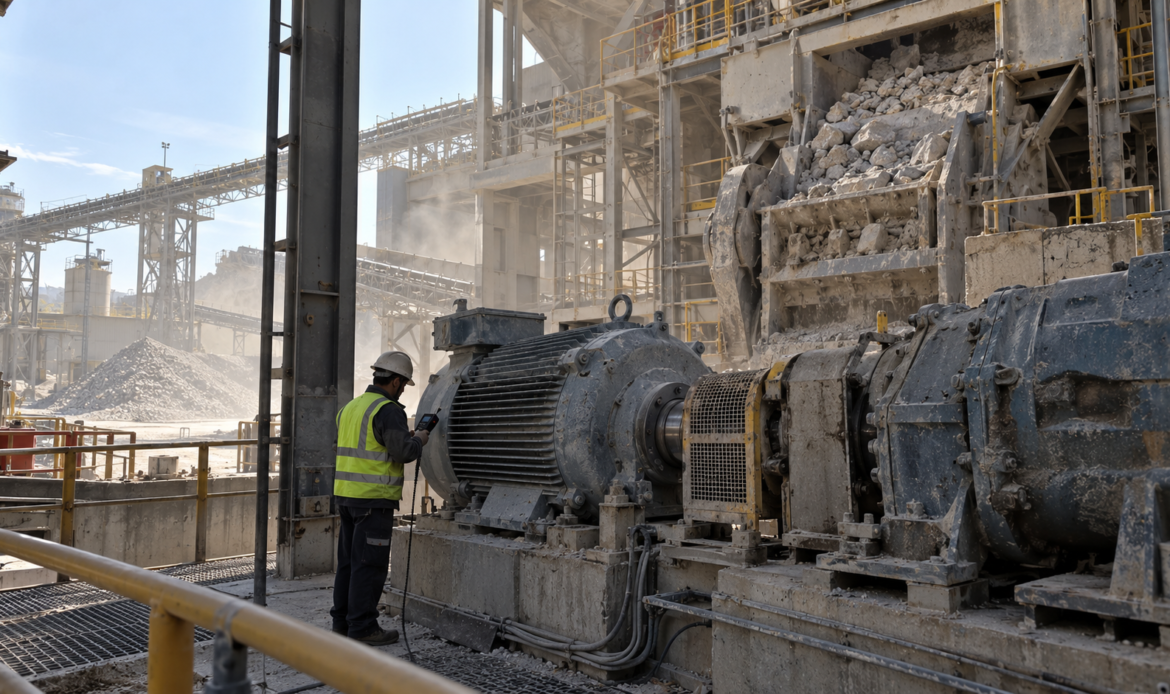
In a cement plant the crusher is where the day starts. Limestone comes in as boulders and leaves as something the rest of the process can handle. If the crusher stops, everything downstream is soon waiting.
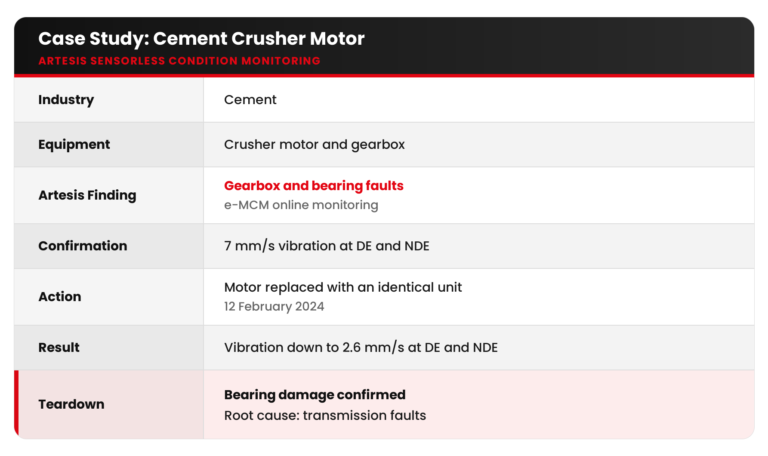
That is why the reliability team at a North African cement plant paid close attention when Artesis e-MCM, monitoring the crusher drive, began reporting rising gearbox and bearing parameters. The spectrum showed clear bearing fault components together with transmission-related energy.
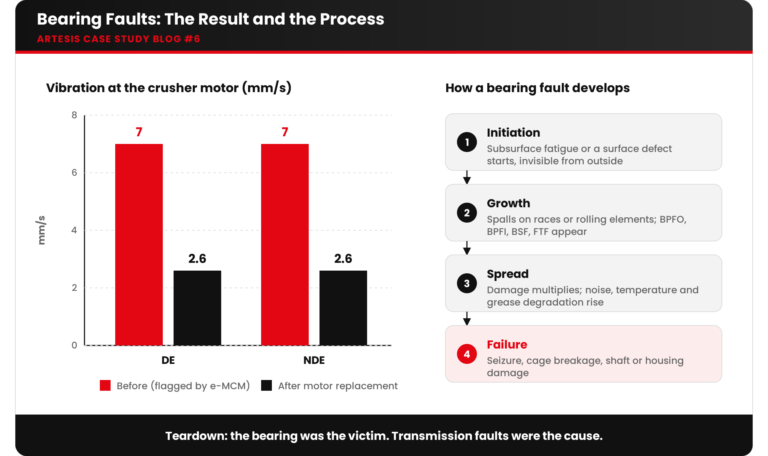
The team checked with a vibration pen and confirmed the warning: 7 mm/s at both the drive end (DE) and non-drive end (NDE) of the crusher motor, well into the range where most standards call for action.
The replacement and the teardown
The plant replaced the motor with an identical spare on 12 February 2024. Vibration fell from 7 mm/s to 2.6 mm/s at both bearings.
The most useful information came from the bench. When the original motor was disassembled, the bearing damage was confirmed, and so was the reason for it. The bearing had not failed on its own. It had been damaged by transmission faults that loaded it well beyond its design. Replacing only the bearing would have started the clock on the next failure.
Why bearings fail
Rolling element bearings rarely just “wear out”. Most failures are caused by something else:
- Misalignment and unbalance, which add radial and axial load
- Transmission problems: over-tensioned belts, worn couplings, gearbox issues
- Looseness, which causes impacting and uneven load
- Lubrication problems: too little, too much, the wrong grease, contamination
- Contamination: dust, water, process material
- Electrical current through the bearing, from VFD common-mode voltage, causing fluting
- Poor installation: wrong fits, hammer damage, misaligned housings
How a bearing fault develops
- Initiation: subsurface fatigue or a surface defect starts, invisible from outside.
- Growth: spalls form on races or rolling elements. Characteristic defect frequencies appear (BPFO, BPFI, BSF, FTF).
- Spread: damage multiplies, noise and temperature increase, lubricant degrades.
- Failure: seizure, cage breakage, or shaft and housing damage.
Electrical signature analysis sees the defect frequencies as sidebands around the line frequency. In other Artesis cases, fault frequencies such as the BPFO of a 6213 bearing on an oil & gas water jockey pump, or an NU244 bearing on a 5.5 kV cement fan, were calculated in the software and matched directly to peaks in the motor current spectrum.
What bearing faults lead to
- Rising vibration and noise
- Higher friction, heat and energy use
- Shaft and housing damage (spun races, worn seats)
- In motors, rotor-to-stator rub and winding damage
- Unplanned downtime, often at the worst possible moment
Correlations to look for
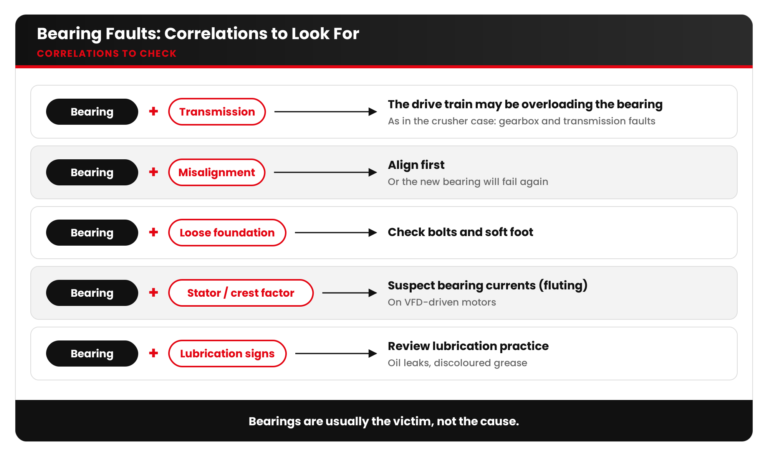
- Bearing + transmission / gearbox: as in this case, the drive train may be overloading the bearing.
- Bearing + misalignment: align first, or the new bearing will fail again.
- Bearing + loose foundation: check bolts and soft foot.
- Bearing + stator / crest factor on VFD drives: suspect bearing currents (fluting).
- Bearing + lubrication-related findings (oil leaks, discoloured grease): review lubrication practice.
Checklist
- When bearing faults are detected, look at all mechanical parameters, not just the bearing bar.
- Confirm with an independent measurement (vibration, temperature, ultrasound).
- When replacing a bearing, record the failure mode (fatigue, fretting, fluting, contamination) and look for the root cause.
- Correct alignment, tension and looseness before restarting.
- Compare the post-repair trend with the baseline to confirm the fix.
Key takeaways
- Bearings are usually the victim, not the cause. Find what is loading them.
- Motor current can reveal bearing defect frequencies and the drive train faults that cause them.
- Confirmed field results, such as 7 → 2.6 mm/s, build trust in online monitoring across the plant.







 White Papers
 Case Study
 Documents
 Webinars
 Events
 ROI Calculator
 FAQ