Every maintenance manager who has tried to get budget approval for a condition monitoring project has run into the same wall: the finance department wants a number, and “it will reduce downtime” is not a number. Predictive maintenance sells itself easily on the shop floor, where engineers can see the value of catching a bearing fault three weeks before it turns into a burned-out motor. Convincing a CFO requires something more concrete — a return on investment calculation that survives scrutiny.
The good news is that ROI for predictive maintenance is not particularly complicated to calculate. The hard part is gathering honest numbers, because most plants underestimate what unplanned downtime actually costs them and overestimate how much a monitoring system will cost to run. Once those two numbers are corrected, the payback period tends to look a lot better than people expect.
What Actually Goes Into the Cost Side
The purchase price of the sensors, gateways, and software license is the easiest number to find and, ironically, the one people focus on most. It is rarely the biggest cost. A realistic cost model for a predictive maintenance rollout includes:
- Hardware: sensors, wiring or wireless nodes, and any edge processing units
- Installation labor, which varies enormously depending on whether sensors need to be wired into a control cabinet or can be mounted without touching existing infrastructure
- Software licensing, usually billed per asset or per year
- Integration work if the system needs to talk to a CMMS or a SCADA platform
- Training time for the maintenance team, which is a real cost even though it rarely shows up on an invoice
- Ongoing calibration and support
Installation labor is where projects quietly blow their budgets. Traditional vibration monitoring systems often require a technician to run cabling from each sensor back to a data acquisition unit, sometimes across an entire production hall. That labor cost can equal or exceed the price of the sensors themselves. This is one of the reasons sensorless monitoring approaches, like the ones Artesis builds around, have gained traction in retrofit projects — when the system can pull signature data from existing electrical connections rather than requiring new wiring to every motor, the installation line item on the cost side shrinks dramatically.
WhitePaper | Electrical Signature Analysis for Compressor Reliability
What Actually Goes Into the Savings Side
This is where most ROI calculations either fall apart or get inflated beyond credibility. The savings side needs to be built from real historical data, not industry averages pulled from a vendor brochure.
Start with unplanned downtime. Pull maintenance logs for the past two to three years and find every unplanned stoppage tied to a mechanical or electrical fault on the assets you’re considering monitoring. For each event, calculate:
- Lost production value (units not produced, multiplied by contribution margin per unit — not full sales price)
- Overtime or expedited labor to fix the fault
- Expedited parts shipping, which can run three to five times the normal cost of a component
- Secondary damage — a failed bearing that also took out a coupling and a seal costs far more than the bearing alone
Add to this the cost of planned maintenance that predictive monitoring can eliminate. Time-based maintenance programs replace components on a calendar schedule regardless of actual condition. A motor bearing rated for five years of service life might get replaced at three years “to be safe.” Condition monitoring lets that same bearing run to actual end of life, which for many components extends replacement intervals by 20 to 40 percent — a saving on both parts and labor that rarely makes it into first-draft ROI models.
Energy consumption is the most overlooked savings category. A motor with a developing electrical fault, a misaligned coupling, or early-stage bearing wear draws measurably more current than a healthy one. On large motors running continuously, a few percentage points of efficiency loss translates into real money over a year. This is a category worth pulling from utility bills and comparing against a baseline once the monitoring system has established a healthy signature for each asset.
A Working Formula
The formula itself is simple:
ROI (%) = [(Total Annual Savings − Total Annual Cost) / Total Annual Cost] × 100
And payback period in months is just:
Payback Period = Total Implementation Cost / Monthly Net Savings
Here’s a simplified example using round numbers, based on a mid-sized plant monitoring 40 critical motors:
- Implementation cost (hardware, install, software, training, year one): $180,000
- Annual software and support cost after year one: $24,000
- Avoided downtime events in year one (three events avoided, average cost $45,000 each): $135,000
- Extended maintenance intervals (parts and labor savings): $38,000
- Energy savings from early fault correction: $12,000
Total annual savings: $185,000 Net savings after subtracting ongoing cost: $161,000 ROI in year one: roughly 89 percent against the implementation cost, with the system essentially paying for itself in just over 14 months.
These numbers will vary widely by industry — a steel mill’s failure costs look nothing like a food processing plant’s — but the structure of the calculation holds regardless of sector.
Common Mistakes That Distort the Numbers
A few errors show up repeatedly in ROI models built by teams new to predictive maintenance:
Using full sales price instead of contribution margin when valuing lost production. This overstates downtime cost significantly, since fixed costs don’t disappear just because a machine is down for a day.
Assuming 100 percent fault detection accuracy in year one. Every monitoring system, including sensorless platforms, has a ramp-up period where baselines are established and false positives get tuned out. Budgeting for a conservative 60-70 percent detection effectiveness in the first six months, rising afterward, produces a more defensible projection.
Ignoring the cost of doing nothing. Boards sometimes compare the monitoring investment against a zero-cost baseline, when the real comparison should include the cost of continuing time-based maintenance and the failures that inevitably slip through it.
Forgetting insurance and safety implications. Some industrial insurers offer premium reductions for documented condition monitoring programs on critical assets, and safety incidents avoided by catching a developing fault before it becomes a catastrophic failure carry a value that’s harder to quantify but shouldn’t be zero.
How to Prevent Motor Failures Thanks To Motor Condition Monitoring?
Where the Numbers Get Easier
One reason ROI conversations around predictive maintenance have shifted in recent years is that the cost side of the equation has gotten smaller. Artesis, for instance, builds its motor and generator monitoring around current signature analysis rather than physical vibration sensors mounted on the machine itself — the system reads electrical signals already available at the motor control center. For plants with dozens or hundreds of assets spread across a large facility, that difference in installation approach can cut implementation cost substantially, which shortens payback period without touching the savings side of the calculation at all.
The takeaway for anyone building a business case is straightforward: pull real numbers from your own maintenance history, be conservative on savings in year one, and don’t let the sticker price of sensors dominate a cost model where installation labor and integration usually matter more. A well-built ROI case for predictive maintenance rarely needs embellishment — the numbers tend to speak for themselves once they’re built honestly.
A Quick Checklist Before Presenting the Business Case
Before taking an ROI model to a capital committee, it helps to stress-test it against a short list of questions that finance teams tend to ask anyway:
- Are downtime costs based on actual historical incidents, or estimated averages from an industry report?
- Does the model separate hard savings (avoided repair cost, extended part life) from soft savings (safety, insurance, morale)?
- Has a conservative detection accuracy been assumed for the first six to twelve months rather than immediate full effectiveness?
- Does the cost side include integration and training time, not just hardware and licensing?
- Is the comparison against continuing current practice, rather than against an unrealistic zero-cost baseline?
A model that can answer all five honestly tends to survive scrutiny in the boardroom a lot better than one built primarily from vendor marketing numbers.
Scaling the Calculation Across a Larger Asset Base
Everything above works cleanly for a single production line or a handful of critical assets. Once a plant starts thinking about scaling condition monitoring across dozens or hundreds of motors, the ROI calculation needs one more layer: prioritization. Not every asset carries the same downtime cost or the same failure probability, and monitoring budget is rarely unlimited even after the first pilot proves itself.
A practical approach is to rank assets by a simple criticality score — replacement lead time, production impact if the asset fails, and historical failure frequency — and build out monitoring coverage starting with the highest-scoring assets first. This produces a rolling ROI picture rather than a single up-front number: the first wave of monitored assets typically shows the strongest payback, since they were chosen specifically because failures there are expensive, and later waves extend coverage to assets where the case is a little less dramatic but still positive over a multi-year horizon.
This phased approach also solves a credibility problem that trips up a lot of first-time proposals. Asking for budget to monitor an entire plant at once, based on projections, is a harder sell than asking for a smaller pilot on ten or fifteen critical assets, proving out real savings against real incidents over twelve months, and then using that documented result to justify expansion. Plants that have gone through this progression consistently report that the second and third phases of a rollout get approved faster and with far less scrutiny than the first, simply because the numbers by that point come from the plant’s own operating history rather than a projection.
Why the Underlying Sensing Approach Changes the Math
It’s worth returning to the cost side one more time, because it’s the variable easiest to influence directly. Two facilities considering condition monitoring for the same forty motors can end up with dramatically different implementation budgets depending entirely on the sensing approach chosen, independent of software features or vendor reputation. A wired vibration sensor approach typically means running cable from each motor bearing housing back to a data acquisition panel, which on an older facility with motors scattered across multiple buildings or outdoor areas can mean weeks of electrician time before the system even begins collecting its first data point.
A current signature approach, sensing from the motor control center or starter panel rather than the motor itself, sidesteps most of that cabling effort entirely, since the electrical connections already exist at the panel where the motor is controlled. This is precisely the model Artesis has built its platform around, and it’s a meaningful part of why the implementation cost line in the ROI formula above can look so different between two facilities evaluating otherwise similar monitoring programs. For a plant weighing whether a predictive maintenance business case will clear the bar its finance team expects, the sensing architecture chosen is often as consequential to the final ROI number as the software analytics running on top of it.
Artesis Solutions Built Around This Exact Business Case
For teams building this ROI model in practice, Artesis offers two products that map directly onto the cost and savings sides discussed above. Artesis e-MCM, the company’s online condition monitoring platform, reads current and voltage signatures directly from the motor control center, which is what keeps the installation cost line so much lower than a wired vibration retrofit — there’s no need to access the motor itself, run new cabling, or take equipment out of service to fit sensors. For plants that want to validate assumptions before committing capital, Artesis also provides a free ROI calculator at artesis.com/calculate-roi/, where a maintenance or reliability team can enter its own asset count, downtime history, and energy costs and get back a payback-period and three-year ROI estimate built on the same formula outlined in this article — rather than a generic vendor projection.
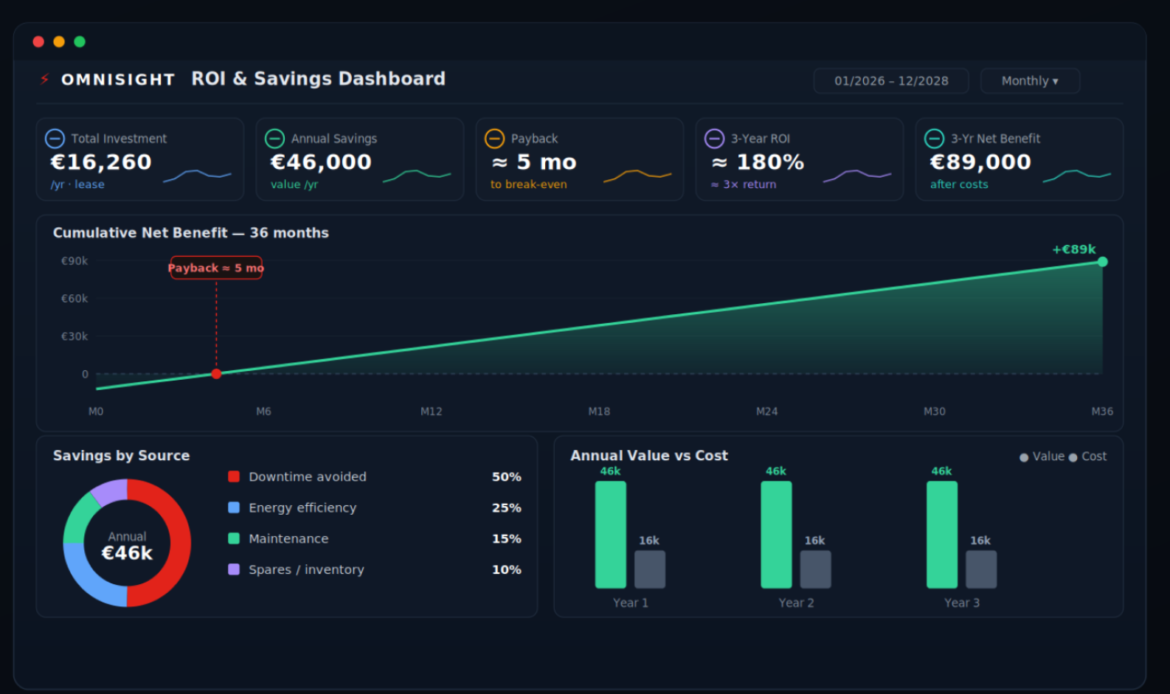
Teams evaluating a phased rollout, as described above, often start with Artesis e-MCM on a critical asset shortlist and later add Artesis Omnisight once the program expands past a single site, since Omnisight consolidates fleet-wide health, alarms, and KPIs into one dashboard, which is exactly what a multi-phase ROI case needs once monitoring coverage grows from a pilot into a plant-wide or multi-site program.







 White Papers
 Case Study
 Documents
 Webinars
 Events
 ROI Calculator
 FAQ
FAQ