
Navigating the complex world of industrial maintenance can feel like trying to solve a giant puzzle. Every piece needs to fit perfectly for the machinery to run smoothly. But how do you measure success and ensure your team is on the right track? It’s all about finding those key performance indicators (KPIs) that really matter. Think of KPIs as your team’s compass, guiding you through the challenges of maintenance work and pointing you towards efficiency and reliability.
So before we dive into the specifics, let’s set the stage for why choosing the right KPIs can make all the difference for your team. We’ll find out how the industrial maintenance team can fine-tune the operations and achieve your objectives more efficiently.
Contents
- 1 Reducing Unscheduled Downtime: A Key to Operational Excellence
- 2 Maximizing Reliability with Mean Time Between Failure (MTBF)
- 3 Navigating the Waters of Reactive Maintenance Work Hours
- 4 Enhancing Manufacturing Efficiency with Planned Maintenance Percentage (PMP)
- 5 Maximizing Production Through Overall Equipment Effectiveness (OEE)
- 6 The “Right” Solution To Help Industrial Maintenance Teams?
Reducing Unscheduled Downtime: A Key to Operational Excellence
Unexpected shutdowns are a significant setback for businesses that rely heavily on continuous operations. The startling reality is that industries face an average downtime cost of a quarter-million dollars per hour, a figure that underscores the gravity of unplanned stoppages. Alarmingly, 70% of businesses are not fully aware of which of their assets are due for maintenance, leading to sudden failures and costly periods of inactivity. Implementing a strategic maintenance plan could cut downtime by a substantial margin, exceeding 30% in some cases.

KPIs focused on tracking unscheduled downtime are invaluable for maintenance supervisors, offering a lens through which the effectiveness of maintenance strategies can be evaluated. Understanding the broad impact of downtime is crucial, as it directly correlates with operational costs and productivity losses, making it imperative for businesses to strive for minimal disruptions in their operations.
Maximizing Reliability with Mean Time Between Failure (MTBF)
MTBF, or Mean Time Between Failures, is a crucial measure for anyone in the maintenance field. It tells you how long a piece of equipment typically runs before it breaks down. Think of it as a score that tells you how reliable your machines are. In simpler terms, MTBF helps you understand how often you’ll need to fix things that can be fixed, like motors, pumps or conveyor belts. This is different from items that you can’t repair once they break, where you’d look at a different measure called Mean Time To Failure (MTTF).
For an example, consider a manufacturing scenario where a bottling line experiences operational failures at intervals. If over a year, the line only fails three times, with operational periods of 120, 150, and 180 days respectively between failures, the MTBF calculation would offer valuable insights into the line’s reliability, guiding maintenance strategies to enhance uptime and efficiency.
This KPI tracks the time spent addressing unplanned repairs or emergencies, offering a snapshot of how much effort is directed towards fixing issues as they arise. This metric is vital for understanding the balance between preventive and urgent maintenance tasks within an organization.
High reactive maintenance hours can indicate a need for more robust preventive measures or signal frequent equipment failures, affecting overall productivity and operational costs. By monitoring these hours, teams can identify trends, allocate resources more effectively, and strive for a more predictive maintenance approach.
Enhancing Manufacturing Efficiency with Planned Maintenance Percentage (PMP)
This key performance indicator measures the proportion of maintenance work that is planned and scheduled in advance versus reactive or emergency work. This KPI is critical because it directly impacts the efficiency and reliability of operations.
A high PMP indicates a proactive maintenance strategy, which can lead to reduced downtime, lower repair costs, and improved asset longevity. By focusing on planned maintenance, teams can ensure smoother operations, minimize disruptions, and predict future maintenance needs more accurately, enhancing overall performance.
Maximizing Production Through Overall Equipment Effectiveness (OEE)
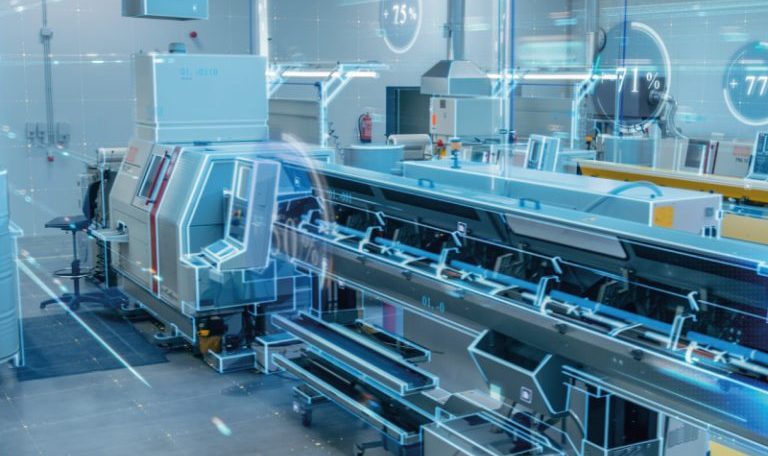
This comprehensive metric evaluates how effectively a manufacturing operation utilizes its equipment. It combines availability, performance, and quality metrics to provide a single figure that reflects the percentage of manufacturing time that is truly productive.
An optimal OEE score signifies that a plant is producing goods at maximum speed, without defects, and with as little stoppage as possible. Tracking OEE helps maintenance teams identify areas for improvement in the production process, aiming to eliminate waste, prevent equipment failures, and ensure product quality, thereby driving operational excellence and competitiveness.
The “Right” Solution To Help Industrial Maintenance Teams?
Industrial maintenance teams can gain significant advantages by incorporating Artesis technology into their operations. This technology simplifies the predictive maintenance process, allowing for seamless monitoring and straightforward, easily understandable data presentation. With its intuitive “traffic light” warning system and automated fault notification sent directly to human-machine interfaces (HMI) and via email, teams are equipped to stay ahead of potential issues. Artesis technology can identify potential failures up to six months before they occur, highlighting issues like unusual vibrations, overheating, or noise anomalies. Furthermore, it facilitates the execution of precise maintenance actions with an accuracy rate exceeding 90%. This proactive approach not only enhances equipment reliability but also optimizes maintenance schedules, reducing downtime and increasing operational efficiency.
Please contact us if you have any other queries or you’d want to book a demo.




 White Papers
 Case Study
 Documents
 Webinars
 Events
 ROI Calculator
 FAQ
FAQ